V-t graphs
Helena Dedic
Exercise 1
Are the following statements always true? Explain your reasoning by showing when they are true and when they may not be true:
a) When the slope of a v - t graph is positive then the acceleration and the velocity point in the same direction.
b) When velocity is zero then acceleration is also zero.
Solution
a) A positive slope in a v - t graph implies that the acceleration is positive. Positive slope does not imply velocity is positive. In the graph sketched below, we see that for t < T the velocity is negative while for t > T the velocity is positive.
Consequently, both acceleration and velocity are positive (pointing in the same direction) when t > T while they point opposite directions when t < T. Therefore the statement is not always true.
b) Acceleration is zero when velocity is constant. Therefore if a particle has constant zero velocity, then we may say that both velocity and acceleration are zero. On the other hand, when velocity is decreasing or increasing, acceleration is not zero. It is possible for velocity to be increasing while the particle slows to zero only for an instant before it begins to speed-up. In such a case the particle has a zero velocity for an instant while the acceleration is never zero. Therefore the satement is not always true.
Exercise 2
Sketch x - t, v - t and a - t graphs which fit the following verbal descriptions of motion (use common axes and distinguish graphs by color, particles by letter):
i. Particle A moves backward while speeding-up. (sketch in blue)
ii. Particle B moves backward, stops for an instant, then moves forward. (sketch in red)
iii. Particle C moves backward at constant velocity and then slows down to a stop. (sketch in black)
Solution
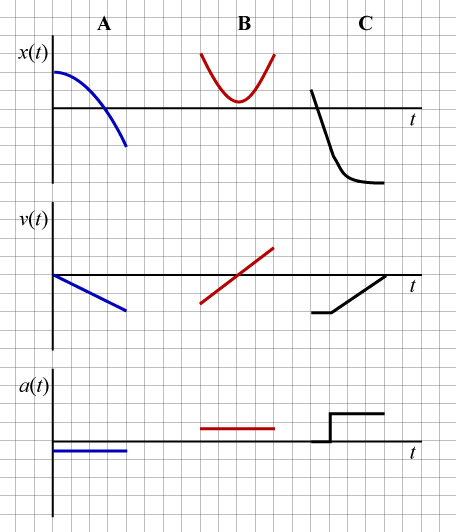
i. Particle A moves backward while speeding-up: this implies that we should draw an x - t graph which has negative slope (particle moves backwards) and concave-down (slope or velocity is increasing). The v - t graph should lie below and move away from the t-axis because the particle is moving backwards--and increasingly quickly. Acceleration should be negative because the x - t graph is concave down.
ii. Particle B moves backward, stops for an instant, then moves forward: we need to draw an x - t graph which is concave-up (slope is increasing); with an initially negative slope (particle moves backwards); and that ultimately is increasing (particle stops and then moves forward). The v - t graph should begin below the t-axis (backward motion implies negative velocity); should then cross the t-axis (the particle stops); and finally should continue above the t-axis (because the particle utltimately moves forward). The acceleration graph should indicate positive acceleration because x - t is concave-up.
iii. Particle C moves backward at constant velocity and then slows down to a stop: we should draw an x - t graph that begins as a straight line with a negative slope (particle moves backward at constant velocity); and that then becomes concave-up (particle slows down to a stop). The v - t graph should begin as horizontal and below the t-axis (particle moves backwards at constant velocity); and should continue straight towards the t-axis (particle slows down to a stop). Acceleration should be horizontal, first along the t-axis (with constant velocity) and then above it indicating positive acceleration (where x - t is concave-up).
Exercise 3
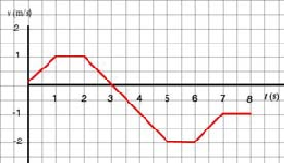
Study the given v - t graph and:
a. determine where the particle has positive acceleration
b. determine where acceleration is zero
c. sketch the corresponding a - t graph
Solution
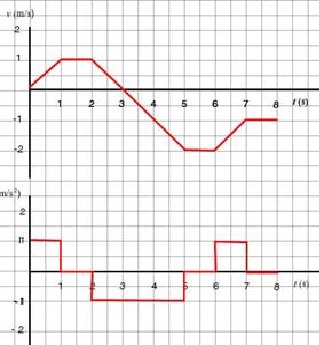
a. The particle has positive acceleration when velocity is increasing. On the intervals (0, 1 s) and (6 s, 7 s), velocity is increasing--slope is positive--and so acceleration is positive.
b. Acceleration is the slope of the v - t graph. The graph has zero slope whenever the graph is horizontal; that is, whenever the velocity is constant. This happens in the intervals (1 s, 2 s), 5 s, 6 s) and (7 s, 8 s).
c. We will compute slopes for each segment of the v - t graph and then we will be able to sketch the corresponding segment along a - t. An examination of the v - t graph reveals that the slope changes at 1 s, 2 s, 5 s, 6 s and after 7 s. Therefore, we will compute slopes on the following intervals of time: (0, 1 s), (1 s, 2 s), (2 s, 5 s), (5 s, 6 s) and (6 s, 7 s). On (7 s, 8 s), the slope of the v - t is apparently zero.
| Interval of time | a |
|---|---|
| (0, 1 s) | 1 |
| (1 s, 2 s) | 0 |
| (2 s, 5 s) | |
| (5 s, 6 s) | 0 |
| (6 s, 7 s) | 1 |
d. We are now ready to plot a - t. Note that the graph should be drawn continously.
Exercise 4
Study the given v - t graph and:
a. sketch the a - t graph for the motion.
b. describe the motion verbally.
Solution:
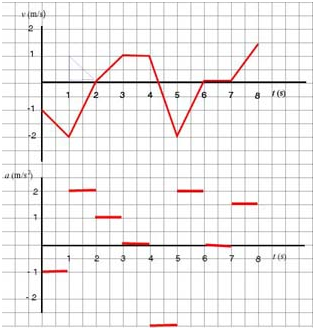
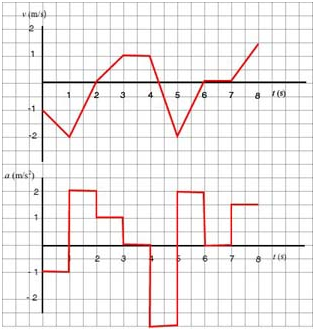
a. Acceleration is defined as the rate of change of velocity, or, in other words, as the slope of the the v - t graph. Since the given velocity graph consists of straight line segments--each having constant slope (e.g., in the interval (1 s, 2 s) the rise is 2 m/s, the run 1 s, making the slope ), the a - t graph will consist of horizontal segments whose "heights" correspond to the values of acceleration as shown below:
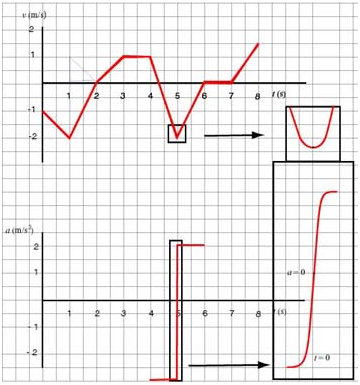
The question is, what do we do with those points where the velocity graph abruptly changes slope? Is it realistic that acceleration should "jump" betweem values? The answer is no. In reality, velocity changes smoothly, so accelaration changes continuously. If we were to zoom in we would see velocity changing smoothly, and, consequently, the corresponding segments of the graph would look rather as in the inserts in the graphs below:
For practical reasons we continue to draw continuous graphs with sharp edges but remember that we are overlooking the details in how acceleration changes:
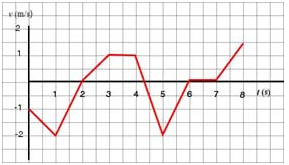
b. The particle moves backwards, speeding up for one second, reaching a maximum speed of 2 m/s. It then begins to slow down, still moving backwards, for another second until it comes to a stop 2.5 m to the left of the origin. The particle then turns and starts moving forward with increasing speed for a second, moving 0.5 m towards the right, reaching a speed of 1 m/s. It then coasts for a second, moving another meter towards the origin. When t = 4 s, still at 1 m to the left of the origin, the particle slows to a rest in a quarter of a second, moving another 12.5 cm towards the right. The particle then turns and again speeds up towards the left until t = 5 s, at which time it begins to slow down, coming to a rest at t = 6 s. The particle is now located at 2.625 m to the left of the origin. It sits stationary for a second, then moves towards the right, reaching a velocity of 1.5 m/s. At t = 8 s, the particle is at 1.825 m to the left of the origin.

