More Exercises
Exercise 1
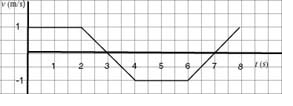
Study the following v - t graph of motion and give a verbal description.
Solution:
The particle moves forwards at 1 m/s for two seconds, reaching a distance of 2 m to the right of the origin. It then slows down for one second, coming to a stop at 2.5 m from the origin. Thus at t = 3 s, the particle turns about, speeding up for one second until it reaches a velocity of - 1 m/s. The particle then continues to move towards the left at a constant speed of 1 m/s for two seconds--at which time it crosses the origin. There, it slows down for one second and comes momentarily to a rest. It then turns again to move forwards, and speeds ahead, at a steady rate, to 1 m/s at t = 8 s--at which time the particle once again arrives at the origin.
Exercise 2
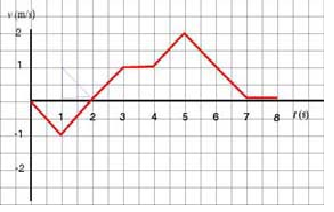
Study the v -t graph below and
a. determine average velocity during the first three seconds of motion.
b. determine where the particle has zero velocity.
c. determine where velocity is decreasing.
d. determine where the particle changes direction.
e. determine where the particle moves forward.
f. describe the motion verbally.
Solution:
a. Average velocity is displacement divided by elapsed time, Δ t = 3 s. But displacement is just the corresponding area under v - t--and we notice that the displacement in the interval (1 s, 2 s) is negative but equal in magnitude to the displacement in the interval (2 s, 3 s) (the shapes of the areas are the same); as a consequence, the total displacement in the first three seconds is really just the displacement in the first second of motion: Δ x = ½ × (- 1 m/s) × 1 s = - 0.5 m. The average velocity is therefore vavg = - 0.5 m/ 3 s = - 0.17 m/s
b. The object has zero velocity wherever the graph hits the t-axis. This happens at t = 0 s, t = 2 s and on the interval (7 s, 8 s).
c. Velocity is decreasing on the intervals (0 s, 1 s) and (5 s, 7 s).
d. The particle changes direction wherever the graph crosses the t-axis. This happens only at t = 2 s.
e. The particle moves forward wherever velocity is positive, and so on the interval (2 s, 7 s).
f. The particle, initially at rest, accelerates backwards, away from the origin, at a rate of . At t = 1 s, at which time it lies a half meter to the left of the origin, with v = -1 m/s, acceleration changes in direction but not magnitude. The particle therefore begins to slow down, while still moving away from the origin. At t = 2 s, the particle momentarily comes to a rest at one meter to the left of the origin; changes direction and starts to move, still with an accleration of , away from the origin. At t = 3 s, acceleration drops to zero. The particle, now at a half metre to the right of the origin, coasts for a second, at a constant velocity of 1 m/s, to get, by t = 4 s, to one and a half metres to the right of the origin. Acceleration then changes to until t = 5 s, during which time the particle moves another one-and-a-half metres towards the right. Now at a distance of 3 metres from the origin, the particle begins to slow at a rate of , and comes to a rest at t = 7 s. And thus the particle sits, stationary, at 5 metres to the right of the origin.
Exercise 3
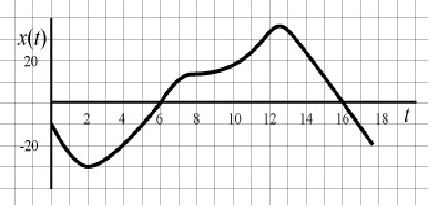
Consider the following x - t graph.
a. When is acceleration positive, velocity zero simultaneously?
b. When is the particle moving forward with negative acceleration?
c. What is the average velocity over the first five seconds of motion?
Solution:
a. Acceleration is positive and velocity zero when x - t is concave-up and changes direction at the same time. In the given case, this happens only when t = 2 s.
b. The particle moves forward with negative acceleration when x - t is both increasing and concave-down. This means position increases with decreasing velocity or slope. This happens roughly on the intervals (6 s, 8 s) and (12 s, 13 s).
c. The average velocity over the first five seconds of motion is zero because the displacement is zero.
Exercise 4
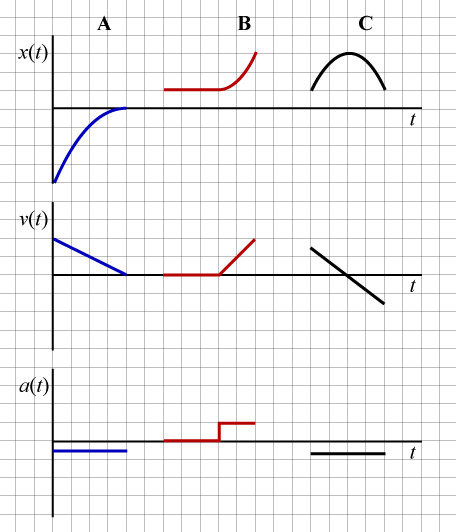
Sketch x - t, v - t and a - t graphs which fit the following verbal descriptions of motion (use common axes and distinguish related graphs by color, particles by letter):
a. Particle A moves forward with decreasing velocity. (To be drawn in blue)
b. Particle B is stationary for a while, then begins to move forward. (To be drawn in red)
c. Particle C slows while moving forward, stops momentarily, turns, and then begins to move backward. (To be drawn in black)
Solution:
a. Particle A moves forward with decreasing velocity. This description implies we should draw an x - t graph with positive slope (particle moves forward) and concave-down (particle moves with decreasing velocity). The associated v - t graph should be drawn above the t-axis (forward motion implies positive velocity), decreasing towards the t-axis. The acceleration graph should be drawn below the t-axis, reflecting the concavity of x -t (or, identically, the slope of v - t).
b. Particle B is stationary for a length, then begins to move forward. This description implies we should draw an x - t graph initially as horizontal (the particle is initially stationary); and then with positive slope (where the particle begins to move forward). The v - t graph should begin as horizontal along the t-axis (reflecting that the particle is initially stationary); and then should continue above the t-axis with positive slope as the particle begins to move forward. Acceleration should be horizontal, first along the t-axis (where the particle is stationary); and then above the t-axis, indicating positive acceleration where velocity is increasing.
c. Particle C slows while moving forward, stops momentarily, turns, and then begins to move backward. This description suggests an x - t graph which is concave-down with an initially postitive slope (the particle moves forward while slowing to a rest); and decreases with change in direction of the particle. The v - t graph should sit above the t-axis while the particle moves forward; should decrease to cross the t-axis as the particle slows to a rest; and should continue to decrease below the t-axis with the change in direction of the particle. Acceleration is all along negative as x - t is concave-down.
Exercise 5
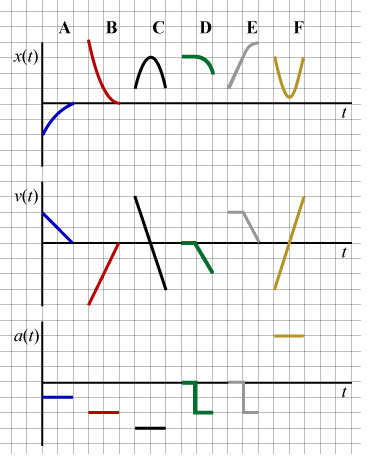
Match the given sets of x - t, v - t and a - t graphs, labeled A - F, which the following verbal descriptions of motion:
i. A particle moves forward, stops an instant, turns, and then moves backward.
ii. A particle is stationary for a length and then begins to move backward.
iii. A particle moves forward while slowing down.
iv. A particle moves backward while its velocity increases.
v. A particle slows down while moving backwards, comes to a rest, turns, then begins to move forward.
vi. A particle moves forward with constant velocity, starts slowing down, then comes to a rest.
Solution:
i. A particle moves forward, stops an instant, turns, and then moves backward. We are therefore looking for an x - t graph that has, initially, positive slope ("moves forward"); and is concave down (since it slows to a stop and then continues backwards). Accordingly, the v - t graph should begin above the t-axis (because of the initial forward motion); the slope should be negative as velocity is decreasing; and should cross the t-axis since the particle comes to a stop (v = 0) and then moves backwards (v < 0). The acceleration graph should indicate negative acceleration since x - t is concave down, or, velocity is decreasing. The set drawn in black, labeled C, best matches this description.
ii. A particle is stationary for a length and then begins to move backward. This implies we are looking for an x - t graph which is initially horizontal, and v - t also horizontal but zero (initially, the particle is stationary). Once the particle begins to move backwards, both position and velocity will assume negative slope. The acceleration graph will indicate an initial acceleration of zero (horizontal line along the t-axis, and then should become negative with decreasing velocity. The best match is D, the set drawn in green.
iii. A particle moves forward while slowing down. This implies we should be looking for an x - t graph with positive slope (particle is moving forward) which is concave down (particle is slowing down). The v - t graph should lie above the t-axis (forward motion implies positive velocity), and should decrease towards the t-axis (particle is slowing down). Accordingly, the acceleration, or slope of velocity, will be negative so the a - t graph should lie below the t-axis. The best match is A, the set drawn in blue.
iv. A particle moves backward while its velocity increases. We should look for an x - t graph which has a negative slope (particle moves backwards) and is a concave up (velocity is increasing). The v - t graph should be below the t-axis since backward motion implies negative velocity; and have positive slope since it is increasing. Accordingly, acceleration graph should be positive x - t is concave up (or, identically, since v - t has positive slope). The red set labeled B matches these conditions.
v. A particle slows down while moving backwards, comes to a rest, turns, then begins to move forward. This tells us to look for an x - t graph that is concave up but initially decreasing; decreasing because it is moving backwards; and concave up because it is slows to a rest (decreases less and less quickly) then changes direction (so begins increasing). The v - t graph begins below the t-axis and crosses where the particle comes to a rest. Velocity then becomes positive with the change in direction of the particle. Acceleration is positive because velocity is increasing all along; accordingly, a - t lies above the t-axis. The best metch is the yellow set, labeled F.
vi. A particle moves forward with constant velocity, starts slowing down, then comes to a rest. This implies we should look for an x - t graph which is initially straight with positive slope (the particle moves forward at constant velocity); and that then becomes concave down with the particle slowing to a stop. The v - t graph should begin horizontal and above the t-axis (constant velocity, forward motion); then the graph takes on a negative slope, as it decrease to the t-axis (particle comes to rest). With constant velocity, acceleration is initially zero (horizontal line along the t-axis); and then it becomes negative with decreasing velocity (as the particle slows to a rest). The best match is the set which is grey, labeled E

