Vtest
Videoclips
See how the horizontal range of a projectile depends on the initial angle of incidence. The initial velocity is the same in each case:
Parabolic motion versus vertical free fall:
Projectile Motion, velocity vector:
The monkey and the gun. The monkey falls downward at the same rate as the bullet. The acceleration due to gravity is the same for both, even though the bullet is fired with a higher initial velocity.
Kreshnik Angoni
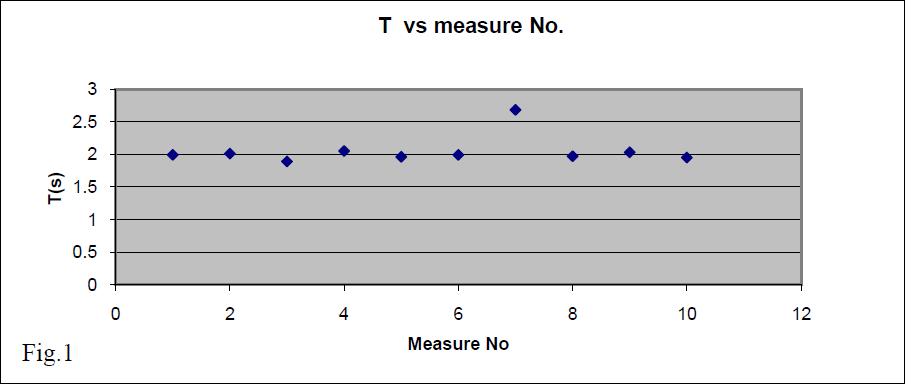
Using graphs during measurements is very important because one can get straight away initial information about high error measurements data and simply avoid them from further treatments. To do this, one must be aware about the possible results.
Estimation of Uncertainties in Measurements Results
First Step
Suppose we want to verify if the period of oscillations is constant or changes in time.
We take several period measurements in different moments and have values 1.99s, 2.01s, 1.89s, 2.05s 1.96s, 1.99s, 2.68s, 1.97s, 2.03s, 1.95s; To have a first information we put these data in a graph. From this graph we have the information that it is very likely that
the T might be constant in time (~2s). The seventh measure seems too far from the other results and this might be due to an abnormal circumstance during measure. To eliminate any doubt, we neglect (cancel) this value from the following error analysis. We have enough other data to work with. Our remaining data are: 1.99s, 2.01s, 1.89s, 2.05s 1.96s, 1.99s, 1.97s, 2.03s, 1.95s;. If necessary, one has to gather new data. Note: Consider five measurements as a minimum number of data for estimating a parameter (repeat 5 times).
Second Step
As no-one knows the real value of period T, we try to find an estimation for this value by using the average of data measurements
Third Step
To get better information about the measurement and its results we need to know the measurements spread. A first way to estimate the spread is by use of “average distance” of data from the average one. So we get
Now we can say that the real value of period is inside the interval (1.982 +/- 0.035)s or it is between T_{max} = 2.017s and T_{min} =1.947s with average value 1.982s. The relative uncertainty of these measurements is
.
As this value is < 5% we can affirm that the period is a constant in this experiment. Note: We will accept that our measurement method is enough precise if the relative uncertainty of measurements for the same value of a physical quantity or a physical constant is .
A second and statistically better way to estimate the spread is by use of “standard deviation” of data
Using standard deviation we find the relative uncertainty of measurements as
This value is < 5%, too. If the relative uncertainty is > 5%, we may proceed by:
a) Cancelling the data “shifted the most from the average value”
b) Increasing the number of data by repeating more times the measurement
c) Improving the measurement procedure
Estimation of Uncertainties for Calculated Quantities (Uncertainty propagation)
Max-Min method
Often, the measurements data of some physical quantities are used to calculate, by the way of a known expression, the value for another physical quantity.
Rule No1:
Calculate the average of the quantity in interest by average values of the measured quantities. Example: The circular frequency of oscillations is calculated as . By using the upper results for period measurement we can calculate .
What is the absolute uncertainty for this estimation of ω?
Rule No2:
We have to define carefully the effect (increase or decrease) of each primary quantity over that in interest and use the minimum and maximum known values of primary quantities.
Note: When calculating an extreme value of the quantity in interest, one selects the combination of maximum or minimum values of primary quantities in dependence on the math function. Example:
and
Note that if the relation was z = x – y one would get and
Note. You may start calculations by finding first and then calculate
Rule No3:
One calculates the absolute uncertainty as
Example:
Rule No4:
One calculates the relative uncertainty of estimation for the calculated quantity as the ratio of
What way must appear the result of our measurements?
The final answer about the upper example is:
The true value of is inside the interval 3.11rad/s and 3.22rad/s.
The estimated average value is 3.17rad/sec
The relative uncertainty of the estimation is 1.89%
Note: Uncertainties of final results are normally quoted to the same number of digits after the decimal point as the average value; the result should then be rounded off appropriately. The use of scientific notation helps to prevent confusion about the number of significant figures. Example: If calculations generate, say A = 0.03456789 ± 0.00245678. This should be presented after being rounded off (one or two significant figure after decimal point ):
A = (3.5 ± 0.2) x 10-2 or A = (3.46 ± 0.25) x 10-2
