X-t graphs
Helena Dedic
Exercise 1
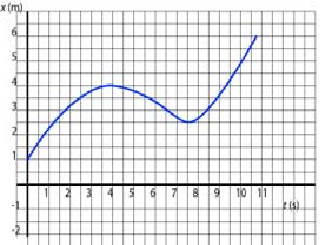
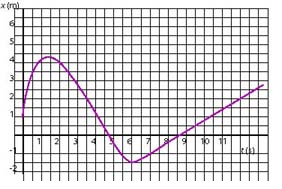
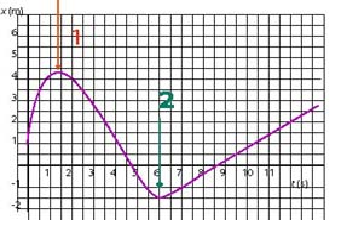
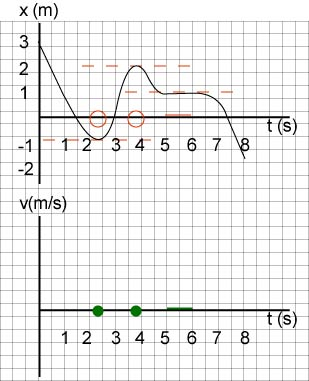
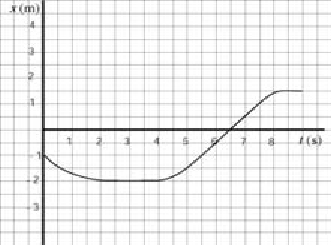
The x - t graph of a moving particle is shown below. Estimate the intervals of time when:
a. the particle moves at constant velocity;
b. velocity is increasing;
c. the particle is moving forward;
d. the particle is at rest.
Solution:
a. Imagine a ruler sliding along the graph and note when its slope does not change. This happens on the interval from 5 to 7.5 s. Note that we exclude segments where the velocity is constant but zero because, although the velocity is constant, the particle is not moving.
b. Imagine a ruler sliding along the graph and note when it turns counterclockwise--meaning that you are looking for segments of the graph with increasing slope. Another image you may associate with increasing velocity is what is called "concave up". This happens on two occasions: (0, 2 s), (4 s, 5s).
c. The particle is moving forward whenever its velocity is positive. We are looking for those segments of the graph where slope is positive. This happens on the interval (4 s, 8.5s).
d. The particle is at rest whenever the graph has a zero slope. This happens on the intervals (2 s, 4 s) and (8.5 s,9 s).
Exercise 2
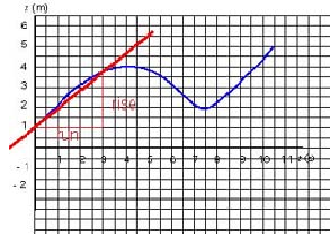
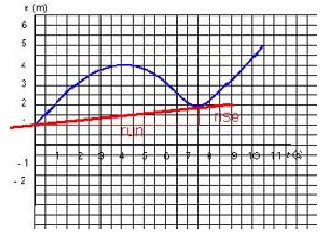
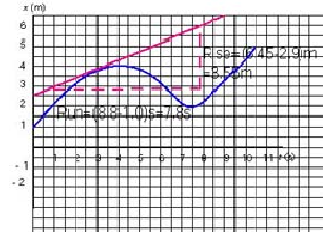
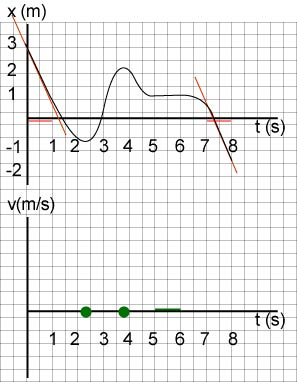
Study the given x - t graph.
a. Determine the average velocity during the first 3 seconds of motion.
b. Determine the average velocity during the first 7.5 seconds of motion.
c. Determine the instantaneous velocity at t = 3 s.
d. Determine the instantaneous velocity at t = 6 s.
Solution
The average velocity is the displacement, Δx, divided by the change in time, Δt:
c) The instantaneous velocity is the slope of the x-t graph at t = 3 s
- The tangent is drawn at t = 3 s.
- The slope of the tangent is the instananeous velocity; we get:
v = 0.45 m/s
(Since drawing the tangent to a curve requires judgement, don't expect to get exactly the same answer)
d) The tangent is drawn at t = 6 s. Its slope is the instananeous velocity.
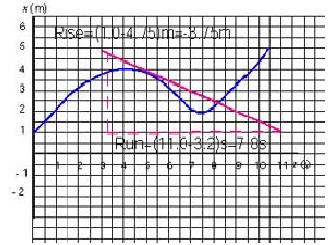
- we get:
v = - 0.48 m/s
Exercise 3
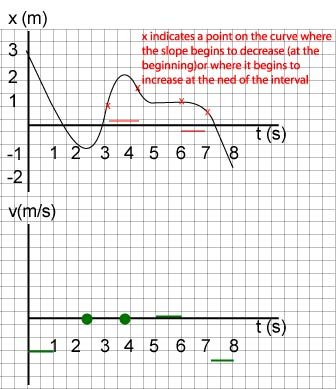
From the given x - t graph of a moving particle, estimate the intervals of time when the particle:
a. moves at constant velocity
b. has decreasing velocity
c. moves backwards
d. is at rest
Solution
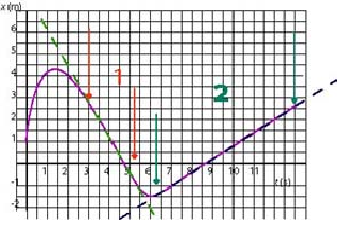
a.
Imagine sliding a ruler along the x-t graph and watching the behaviour of the slope. The arrows show the beginning and the end of the two regions where the slope of the graph is constant, namely, where 3 s < t < 5.5 s and when 6.3 s < t < 13 s:
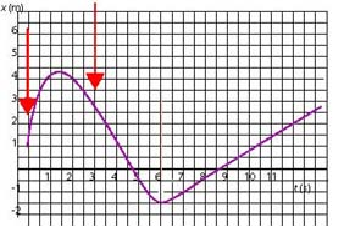
b.
The arrows show the beginning and the end of the region where the slope decreases, i.e., the velocity decreases: 0 s < t < 3 s:
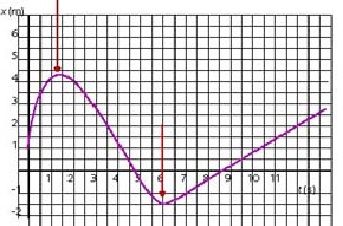
c.
The arrows show the beginning and the end of the region where x decreases and the particle moves backwards; that is, where 1.4 s < t < 6 s:
d.
The arrows show the instants of time where the slope is zero, i.e., the particle is at rest: at t = 1.4 s and t = 6 s:
Exercise 4
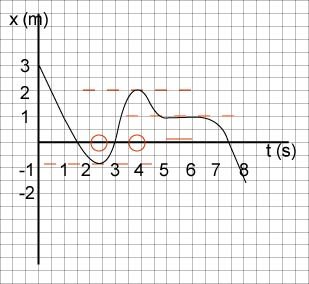
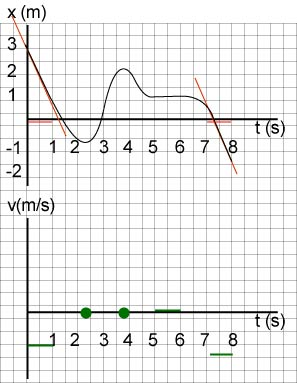
Study the x - t graph below:
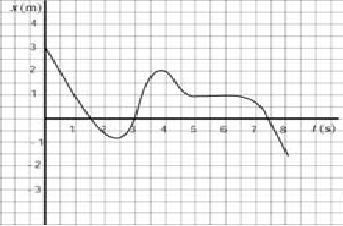
a. Determine the average velocity during the first three seconds of motion.
b. Determine the average velocity on the interval (1 s, 5 s).
c. Determine the instantaneous velocity at t = 1 s, t = 2 s and t = 3 s.
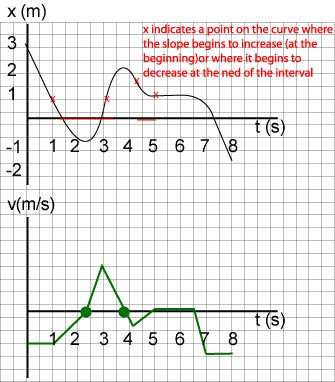
d. Sketch a v - t graph for this motion.
Solution
a. The average velocity is the change in displacement, Δx, divided by the time interval, Δt; in symbols: = Δx / Δt
Thus in the first three seconds, = (0 - 3) m / (3-0) s = -1 m/s
b. Average velocity on the time interval (1, 5) is: = (1 - 1) m / (5-1) s = 0 m/s
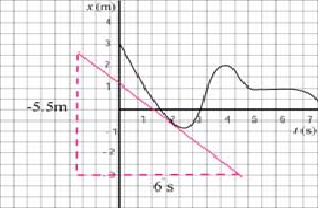
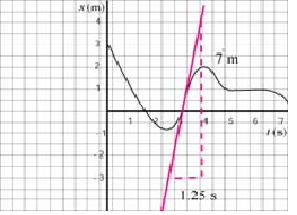
c. The instantaneous velocity is the slope of (the tangent to) the x-t graph.
At t = 1 s: We draw the tangent to the curve at t = 1 s; the slope, or instananeous velocity at 1 s is: v = -7m / 4s = - 1.7 m/s (Since drawing the tangent to a curve requires judgement, don't expect to get exactly the same answer)
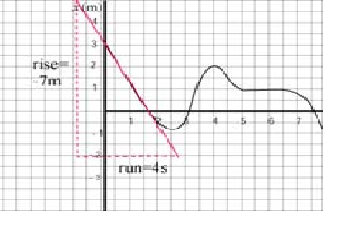
At t= 2 s: we draw the tangent line to the curve and calculate its slope, the instantaneous velocity: v = -5.5 m / 6 s = - 0.9 m/s.
At t = 3 s: again, we draw the tangent line to the curve at t = 3 s; we find the slope, the instananeous velocity: v = 7 m / 1.25 s = 5.6 m/s.
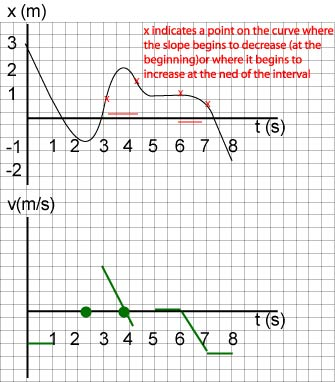
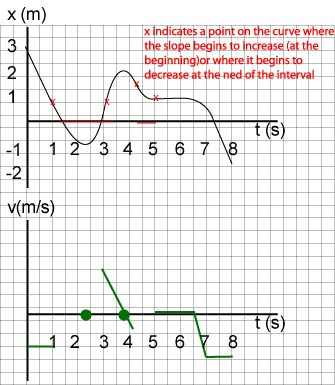
d. Sketch a v - t graph for this motion.
