Relationships between Graphs
Helena Dedic
Exercise 1
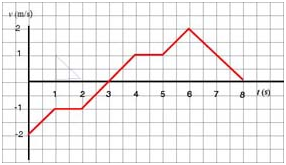
Study the v -t graph below and
a. determine when the velocity is increasing.
b. determine when the particle stops for a moment.
c. determine when the particle changes its direction of motion.
d. determine when the particles moves backward.
e. determine the initial velocity.
f. sketch the x - t graph for the motion.
Solution:
a. The velocity is increasing when the slope of the v - t graph is positive. A glance at the graph tells us that the slope is positive during these intervals of time: (0 , 1 s), (2 s , 4 s), (5 s , 6 s).
b. The particle stops for a moment when the graph crosses the t-axis which happens at t = 3 s. It looks like it will cross the axis at t = 8 s but we don't know what happens at 8 s and beyond where the particle may remain at rest or resume motion. For this reason we will not include this time in our answer.
c. The particle changes direction of motion when its velocity changes sign which happens at t = 3 s. The velocity is negative before and positive after t = 3 s.
d. The particle moves backward when its velocity is negative which happens during the first three seconds of motion.
e. We can read the initial velocity off the graph - it is the value of "y-intercept". The initial velocity is - 2 m/s.
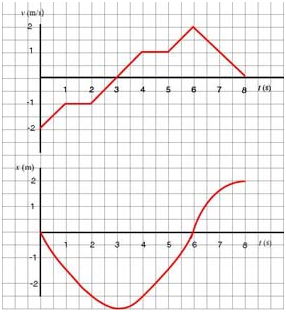
f. We will follow the same procedure as before in sketching the x - t graph:
- The particle has a constant velocity during the intervals of time: (1 s, 2 s), (4 s, 5 s). The graph will be a flat straight line during these intervals of time.
- Identify the intervals of time when the velocity is zero: 3 s, 8 s; both of these points are the points at which the x - t has a horizontal tangent line.
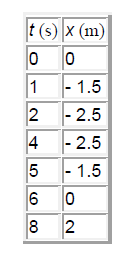
- We will compute the position at t = 1 s, 2 s, 4 s, 5 s, 6 s, 8 s.
- The v - t and x - t graphs are as follows:
Exercise 2
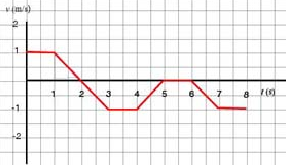
Study the given v - t graph and:
a. determine when velocity is equal to zero.
b. determine the velocity at t = 3.5 s.
c. determine when the particle is moving forward.
d. determine the interval (or intervals) of time when the particle is not moving.
e. sketch an x - t graph for this motion.
f. describe the motion verbally.
Solution:
The first thing we have to realize is that the graph is a plot of instantaneous velocity versus time which means that every point on the plotted curve has coordinates (v(t) , t). More concretely, we have to know that at t = 1 s the velocity is v = - 1 m/s or at t = 5 s the velocity is v = 2 s m/s. Most errors in solving problems of this kind are caused by forgetting that we are dealing with a v - t graph and not an x - t graph.
The second thing we have to remember is that the slope of this graph indicates the acceleration. This means that a flat graph indicates that the velocity is constant!
And, finally, we have to know that the area under the graph tells us about the displacement during an interval of time . When we say "area under the graph" we mean an area bound by the segment of the t-axis by the segment of the vertical line drawn from point on the axis to the corresponding point on the curve, by another segment of the vertical line drawn from point on the axis to the corresponding point on the curve and by the segment of the curve . It is important to note that the displacement is positive if the area is above the t-axis and negative if it is below the t-axis. For example, the displacement during the interval of time (1 s,2 s) is equal to the shaded area shown below. The blue lines indicate the boundaries of this area.
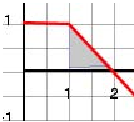
The area of this triangle is equal to . It is important to note that we have found the displacement during this interval of time. To determine the position at the end of this interval of time, we have to add the displacement to the position of the particle at the beginning of the interval of time. In this particular case, the position of the particle was 0 at t = 0. During the first second of motion the particle travelled 1 m and therefore at the beginning of the interval of time we dealt with the position was 1 m. The position at t = 2 s is the sum of the initial position and the displacement or 1 + 0.5 = 1.5 m. Similarly, the displacement during the interval of time (3 s, 4 s) is shown by the shaded area in the graph below.
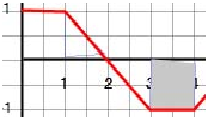
In this case, the area is below the t-axis and so the displacement is equal to . To find the position at 4 s, we would have to add - 1 m to the position at 3 s.
- a. The velocity is equal to zero when the graph "crosses" the t-axis. This happens at t = 2 s and during the interval of time (5 s, 6 s).
- b. We can read off the graph that the velocity at t = 3.5 s is - 1 m/s.
- c. The particle is moving forward when its velocity is positive. We are looking for the intervals of time when the graph is above the t-axis which happens during the first two seconds or (0 , 2 s).
- d. The particle is not moving when its velocity is equal to zero. The only interval of time when this happens is (5 s, 6 s).
- e. To sketch the x - t graph we have to do four things:
- 1. first, identify the intervals of time when the particle moves at constant velocity (the graph is a horizontal line) which indicates that this segment of the x - t graph will be a straight line with some slope.
- 2. second, identify the intervals of time when the particle has zero velocity (crosses the t-axis), which means that this segment of the x - t graph will be either a horizontal line or a curve with a horizontal tangent line.
- 3. decide at which instants of time we should compute the positions of the particle and then generate a table of values.
- 4. finally sketch the graph.
- 1. first, identify the intervals of time when the particle moves at constant velocity (the graph is a horizontal line) which indicates that this segment of the x - t graph will be a straight line with some slope.
- Let's carry out these steps:
- 1. The particle moves at constant velocity during the intervals (0 , 1 s), (3 s , 4 s), (7 s , 8 s).
- 2. It has zero velocity at t = 2 s (a horizontal tangent) and during the interval of time (5 s , 6 s) (a horizontal line).
- 3. We will compute the positions at 1 s, 3 s, 4 s, 5 s, 7 s, 8s
- 1. The particle moves at constant velocity during the intervals (0 , 1 s), (3 s , 4 s), (7 s , 8 s).
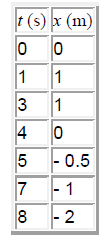
- The v - t and x - t graphs are as follows:
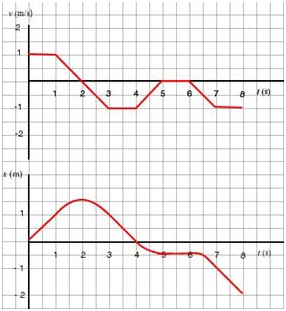
- f. This particle moves forward for one second and then it begins to slow down until it stops for an instant at t = 2 s. It turns and moves backward while its velocity decreases(!) to - 1 m/s but its speed increases. It returns to its starting point at t = 4 s. Then it continues to move backward for one second while slowing down, stops for one second and then resumes a backward motion for two more seconds.
